
A new model showing the Solar System has expanded
by 50% since its formation
and what it means for Mars,
the Moon, and the Faint Young Sun paradox.
The Universe has been physically expanding for 13.8 billion years (the half‑life of Thorium‑232). The Solar System has been physically expanding for 4.6 billion years (the half‑life of Uranium‑238). For the purpose of this presentation let's refer to this Solar System Birth as the (SSB), which began when the Universe was 2⁄3 of its current size. Is the expansion of the Universe all‑encompassing? Let us consider what would happen if the Solar System expanded in the same way, increasing at the same rate. We can refer to it as the Local Hubble Expansion.
Won't the force of gravity override any expansion?
Isn't our Solar System "gravitationally bound"?
The "truly bound" structures are kept together
by the electromagnetic force and the strong nuclear force.
Cosmic expansion happens everywhere curved space is the rule.
Note that gravity is fundamentally different than
electromagetism or nuclear forces.
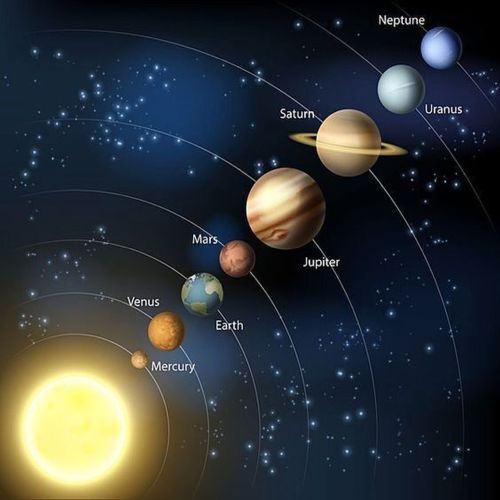
In our local case the planetary orbits do expand.
And no, gravity is not a force; it is a curvature of spacetime,
and as the Universe expands, so does spacetime.
Note that the very small, photons themselves,
obey the expansion of the Universe. Their wave packet length
would also have lengthened by 50% since the creation
of the Solar System.
 Credit:Physics Astronomy
At the time of the formation of the planets, Mars was in the true Goldilocks zone as its semi‑major axis was then 1.0 au. This is now Earth's orbit, when the Sun was 70% as bright as it is today. How does the Sun's distance affect each planet's sunlight? They would have received 1.52 = 2¼ more sunlight per area falling on the planet.
The following table shows the amount of solar energy that currently reaches the outer atmosphere of each planet. Consider the solar energy at the SSB. There are two factors to consider. The smaller size of the Solar System by one third as well as the faint young sun(fys) hypothesis. For example, Mars now gets 605 watts/m² but at the SSB the solar energy was 953 watts/m².
The planets of the Solar system
| planet |
semi‑major axis at the SSB in au |
solar energy in watts/m² at the SSB | adjusted for fys hypothesis solar energy in watts/m² at the SSB |
solar energy now in watts/m² |
semi‑major axis now in au |
semi‑major axis in five billion years in au |
Increase of semi‑major axis each year in metres |
|---|---|---|---|---|---|---|---|
| Mercury | 0.258 | 20,446 | 14,312 | 9,087 | 0.387 | 0.527 | 4 |
| Venus | 0.482 | 5,858 | 4,101 | 2,604 | 0.723 | 0.985 | 8 |
| Earth | 0.667 | 3,062 | 2,144 | 1,361 | 1.000 | 1.362 | 11 |
| Mars | 1.0 | 1,361 | 953 | 605 | 1.5 | 2.043 | 16 |
| Asteroids | 1.83 | 405 | 283 | 180 | 2.75 | 3.746 | 30 |
| Jupiter | 3.469 | 113 | 79 | 50 | 5.203 | 8.088 | 56 |
| Saturn | 6.358 | 34 | 24 | 15 | 9.537 | 12.992 | 103 |
| Uranus | 12.794 | 8.3 | 5.8 | 3.7 | 19.191 | 26.144 | 208 |
| Neptune | 20.0 | 3.4 | 2.4 | 1.5 | 30.0 | 40.870 | 325 |
The above table includes the orbital radii of the planets for five billion years in the future when the sun is expected to achieve red giant status.
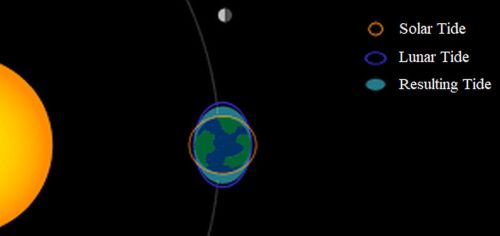
The Earth‑Moon distance is now 384,400 km. At the Solar System Birth (SSB) it was at a distance of 256,267 km. Universe Expansion has increased it by 2.78 cm ⁄year. The observed increase of the Earth‑Moon distance is now 3.78 cm⁄year; The other 1.00 cm⁄year is due to gravitational interactions from Earth's ocean tides. This suggests that the increasing Earth‑Moon distance is ¼ tidal forces and ¾ universe expansion. Note that these computed values are not the result of a simulation, but use values widely accepted for universe expansion.
The Universe expansion constant H0 at 70.845 km/s per Megaparsec recalculated to the Saturn‑Titan distance is 8.85 cm/year. The other 2.45 cm/year is due to gravitational interactions from Saturn tidal effects.
 Credit:NASA
This Earth table goes back to the SSB describing the amount of sunlight reaching the planet.
The initial column shows certain events, such as when the Jovian planets form.
The second column shows how far back in time the period that we examine.
The third column shows the length of planet's semi-major axis in billions of metres.
The fourth column is the amount of calculated sunlight received with an increasing output from the Sun. According to the Faint Young Sun hypothesis, it is assumed to have a value of 70% at the SSB, and now has a value of 100%. Over this range we are assuming a linear increase in luminosity.
The fifth column is the amount of sunlight reaching the planet based on the increasing distance of the Sun due to the expansion of the Solar System.
The sixth column is simply multiplying the third and fourth columns to produce the effective sunlight. This shows that the effective sunlight was 57% greater at the SSB than it is today. That includes Mars as well.
The seventh column is the sunlight reaching the planet if the Sun's output was constant.
The eighth column has been adjusted, allowing for the amount of sunlight being emitted from a cooler Sun to a warmer Sun.
The ninth column has not been adjusted due to tidal forces, showing the Earth-Moon distance in millions of metres.
The tenth column has been adjusted due to tidal forces, showing the Earth-Moon distance in millions of metres.
Earth in a physically expanding Solar System
| Earth Events |
Millions of years ago |
au in Gm (linear) | Faint Young Sun hypothesis (linear) | Expansion Factor (quadratic) | Effective Sunlight | Solar Energy with expansion and no Faint Young Sun | Solar Energy with expansion and with Faint Young Sun | Earth Moon distance in Mm ignoring tidal effects | Earth Moon distance in Mm including tidal effects |
|---|---|---|---|---|---|---|---|---|---|
| Solar System Birth | 4.6 | 100 | 0.700 | 2.25 | 1.575 | 3,062 | 2,143 | 256.3 | 210.2 |
| Jovian planets form | 4.59 | 100 | 0.701 | 2.245 | 1.574 | 3,056 | 2,142 | 256.5 | 210.1 |
| Sun fuses Hydrogen | 4.55 | 101 | 0.703 | 2.226 | 1.565 | 3,029 | 2,129 | 257.7 | 212.1 |
| Hadean Terrestrial planets form | 4.5 | 101 | 0.707 | 2.202 | 1.557 | 2,997 | 2,119 | 259.1 | 214.0 |
| Hadean HCN arrives on Earth | 4.4 | 102 | 0.713 | 2.155 | 1.537 | 2,933 | 2,091 | 261.9 | 217.8 |
| Hadean LUCA appears on Earth | 4.2 | 104 | 0.726 | 2.066 | 1.500 | 2,812 | 2,042 | 267.4 | 225.3 |
| Archean Continents form | 3.9 | 108 | 0.746 | 1.943 | 1.449 | 2,644 | 1,972 | 275.8 | 236.7 |
| Archean Stromatolites | 3.2 | 115 | 0.791 | 1.695 | 1.341 | 2,307 | 1,825 | 295.3 | 263.2 |
| Archean Cyanobacteria | 2.6 | 122 | 0.830 | 1.518 | 1.260 | 2,066 | 1,715 | 312.0 | 286.0 |
| Archean Oxidation Events | 2.4 | 124 | 0.843 | 1.465 | 1.235 | 1,994 | 1,681 | 317.5 | 293.5 |
| Proterozoic Photosynthesis | 1.75 | 131 | 0.886 | 1.312 | 1.162 | 1,785 | 1,582 | 335.7 | 318.2 |
| Proterozoic Mitochondria | 1.5 | 134 | 0.902 | 1.259 | 1.136 | 1,713 | 1,545 | 342.6 | 327.6 |
| Proterozoic Snowball Starts | 0.72 | 142 | 0.953 | 1.113 | 1.061 | 1,515 | 1,444 | 364.3 | 357.1 |
| Proterozoic Snowball Ends | 0.64 | 143 | 0.958 | 1.1 | 1.054 | 1,497 | 1,434 | 366.6 | 360.2 |
| Phanerozoic Cambrian explosion | 0.54 | 144 | 0.965 | 1.083 | 1.045 | 1,474 | 1,422 | 369.4 | 364.0 |
| Phanerozoic The Present | 0.00 | 150 | 1.000 | 1.000 | 1.000 | 1,361 | 1,361 | 384.4 | 384.4 |
Distribution of Solar Energy over time
This distribution table shows the solar energy
under three scenarios.
The orange line graph
shows what the solar energy would be if there was
Solar Energy with expansion and
no
Faint Young Sun.
The green line graph
shows what the solar energy would be if there was
Solar Energy with expansion and
with
Faint Young Sun.
The blue line graph
shows what the solar energy would be if there was
Solar Energy with
no
expansion and
no
Faint Young Sun.
The Mars table also goes back to the SSB describing the effects of the amount of sunlight reaching the planet, with different event points.
Mars in a physically expanding Solar System
| Mars Events |
Billions of years ago |
au in Gm (linear) | Faint Young Sun hypothesis (linear) | Expansion Factor (quadratic) | Effective Sunlight | Solar energy watts/m² (cubic) |
Solar energy Adjusted by Faint Young Sun hypothesis |
|---|---|---|---|---|---|---|---|
| Solar System Birth | 4.6 | 150 | 0.700 | 2.25 | 1.575 | 1,328 | 930 |
| Jovian planets form | 4.59 | 150 | 0.701 | 2.245 | 1.574 | 1,325 | 929 |
| Sun fuses Hydrogen | 4.55 | 151 | 0.703 | 2.226 | 1.565 | 1,313 | 923 |
| Terrestrial planets form | 4.5 | 152 | 0.707 | 2.202 | 1.557 | 1,299 | 918 |
| Extensive volcanism | 4.0 | 160 | 0.739 | 1.983 | 1.465 | 1,170 | 865 |
| Extensive water outflow | 3.7 | 165 | 0.759 | 1.867 | 1.417 | 1,101 | 836 |
| Slow iron‑oxidation | 3.5 | 168 | 0.772 | 1.795 | 1.386 | 1,059 | 818 |
| Loss of atmosphere | 3.0 | 176 | 0.804 | 1.633 | 1.313 | 963 | 774 |
| The Present | 0.0 | 225 | 1.000 | 1.000 | 1.000 | 590 | 590 |
These are extraordinary claims. Yet, they acknowledge basic questions.
First, about the late start of life on Earth. At the time of genesis, the Earth was then closer to the Sun than Venus is now, possibly too hot for life to begin. Some theories suggest very cold, even freezing, conditions might have been beneficial for concentrating key precursors such as hydrogen cyanide (HCN) and promoting their polymerization into nucleic acid bases. Earth may have had to move further from the Sun so that the needed cooler temperatures could support life.
Second, this explains why Mars had a warmer and wetter atmosphere. It has features, such as riverbeds, lakebeds, and even ocean beaches, as well as a newly located vast underground reservoir of liquid water deep below its surface. This indicates a past climate in which temperatures were above freezing, allowing liquid water to exist on its surface.
Third,
the no-expansion hypothesis does not match the historical
increase of the Earth-Moon distance, whereas the expansion
hypothesis gives exceptional agreement. The current rate
of the Moon's recession is considered unusually high.
Earth's geological past calculates the recession primarily
through the analysis of tidal rhythmites and growth patterns
in ancient fossils, which provide physical evidence for a
shorter day length and a closer moon in the distant past.
This 1.00 cm/year figure is an estimate
for the average recession rate of the Moon.
Fourth, this solves the Faint Young Sun paradox, first introduced in 1972 by Carl Sagan and George Mullen. As the Sun evolved, its brightness was 70% of what it is today. So, why was Earth not frozen? The expansion hypothesis resolves the paradox. It shows that the early Earth was closer to the Sun and actually received 1.575 times more solar energy per square metre hitting the Earth's upper atmosphere than today. This may have been too hot for a snowball Earth. As for Mars it started losing its atmosphere three billion years ago when its solar radiation was 30% higher than it is today.
Fifth, this is the reason for the outward migration of the planets. There is no need to explain the migration of Uranus and Neptune by postulating "gravitational attraction" by unspecified masses. There is also the Nice Model:The leading model for our solar system's evolution suggests the gas giants started in a more compact configuration (true). Jupiter, Saturn, Uranus and Neptune migrated significantly outward to their current positions, scattering a disk of planetesimals in the process. This model assumes that the inner rocky planets (Mercury, Venus, Earth and Mars) have also migrated outward at the same rate. That rate is the current(and constant) expansion of the Universe(the speed of light). The speed of light does not have a speed limit. It is a direct consequence of the expansion of the universe.
Citations:
Leslie King, Heikki Sipilä 2022
Cosmological expansion in the Solar System
J.A.M. Green, M. Huber, D. Waltham, J. Buzan, M. Wells
Explicitly modelled deep‑time tidal dissipation and its implication for Lunar history
Jon Spencer
The Faint Young Sun Problem Revisited
Michal Křížek, Vesselin G. Gueorguiev, André Maeder
An alternative explanation of the orbital expansion of Titan
and other bodies in the Solar system